RDT TESTING
Reliability Demonstration Testing (R.D.T.) is performed to verify that a product will meet an expected use in hours or MTBF. The process involves creating a test plan that specifies the sample size, acceleration factor, test duration, stress level, and confidence level. The test plan will then be implemented by monitoring functional units at an elevated temperature for a given time period until the MTBF goal is achieved.
Failures in electronics equipment can generally be traced to long-term chemical interactions, or material fatigue caused by mechanical stress or temperature variations. A compromise of insulating properties and conductive properties in some materials may occur over time. Mathematical models will be used to predict how long reactions will take and how severe they will be as a function of environmental factors. The simplest model for electronic equipment is the Arrhenius equation.
The Arrhenius equation was first proposed by the Dutch chemist J.H. van’t Hoff in 1884 and then interpreted in 1889 by the Swedish physical chemist Svante Arrhenius. It has its roots in the molecular motion within chemical reactions, where reaction rates increase with increasing temperature and decreasing activation energy.
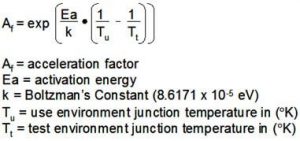
Since many failure modes depend on chemical reactions, the Arrhenius equation was adapted for use in reliability testing. The Arrhenius Model is applicable when elevated temperature is the accelerating stress and potential failures depend on molecular activity. The products under test are operated at a constant elevated temperature for a defined time period until the reliability test goal is met.
The Arrhenius equation is shown below.
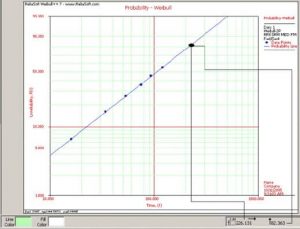
If failures occur on the units under test, a Weibull distribution will be used to calculate the product reliability life assessment. Four failures must occur to perform the Weibull calculation.
The Weibull objective of an accelerated life test is to accurately predict the BX life at the use stress level by using the failure data obtained from accelerated stress test. For example, the objective could be to accurately estimate the B10 life of a product, the time at which 10% of the units are expected to have failed. The accuracy is measure in terms of the width of the confidence bounds at a given confidence level. A result with narrow confidence bounds is more accurate than a result with wide confidence bounds (i.e. there is less uncertainty). Paraphrased from Reliasoft “Accelerated Life Test Plans”.
Below is an example of a Weibull plot. The blue dots are failures in time.